In 2022, I saw a need in the GIS and .NET communities to bridge the gap between the powerful interactive GIS mapping of ArcGIS and the moder...
In today’s data-driven world, mapping business trends and insights can turn complex problems into actionable strategies. Using geographic information system (GIS) tools make this possible by transforming location-tagged datasets into dynamic, interactive maps and charts. Whether you're pinpointing the perfect spot for a new store, analyzing customer demographics, or optimizing delivery routes, GIS lets you uncover insights you can’t see in spreadsheets alone. For businesses using Asp.NET Core, tools like GeoBlazor and ArcGIS make it easier than ever to create shared web and mobile GIS solutions that bring your data to life.
NOTE: The maps on this page are hosted as independent iframes running Blazor in WebAssembly. This is great for being able to quickly embed a variety of different GeoBlazor maps into a non-Blazor blog. However, the loading performance is definitely slower than what you should experience in a typical Blazor application, which would only have to load the WebAssembly and JavaScript one time. They also occasionally run out of memory, which can usually be fixed by either clicking the refresh link inside the iframe, or doing a hard refresh on the whole page.
What is Geospatial Information?
Geospatial data refers to information linked directly to specific geographical locations—a definition that comes to life through everyday examples. Addresses, for instance, are vital for shipping, billing, home construction, and public works. (click on any of the orange polygons in the map below to see address details.)
National Address Database - Overview (arcgis.com)
Route navigation data fuels the logistics behind shipping and tracking, while precise GPS coordinates enable advanced applications like monitoring crops with IoT sensors or tracking moving vehicles.
Hurricane Evacuation Routes - Overview (arcgis.com)
World Traffic Service - Overview (arcgis.com)
The use of political boundaries as geospatial data helps ensure compliance with local laws or analyze trends within neighborhoods. For example, tools like the Location Affordability Index leverage these boundaries to offer valuable insights.
Location Affordability Index - Overview (arcgis.com)
Businesses can even overlay public datasets, such as weather forecasts or ecological information, to understand how external events might impact operations—or how their operations might affect the environment.
National Weather Service Precipitation Forecast - Overview (arcgis.com)
Building GIS-Powered Applications with GeoBlazor and ArcGIS
The samples above showcase the capabilities of GeoBlazor, an open-source Asp.NET Blazor library powered by the ArcGIS Maps SDK for JavaScript. GeoBlazor allows you to seamlessly integrate interactive maps to your .NET web and mobile applications. Each sample includes a MapView, which combines a Map and multiple Layers of hosted data and imagery sourced from the ArcGIS Living Atlas, a vast repository of global geospatial content.
Getting started is straightforward: ArcGIS offers free developer accounts with an extensive free tier, pay-as-you-go options, and the ability to create free API keys for accessing data in your own applications.
Beyond defining Maps and layers in C#, you can also leverage WebMaps - pre-defined maps with curated content and styles.
Imagery with MetaData (arcgis.com)
ArcGIS also supports 3D geospatial visualizations through the SceneView and WebScene.
Paris 3D - Vélib - Overview (arcgis.com)
Mountain Biking in Bavaria - Overview (arcgis.com)
Finally, you can enhance any map or scene with Widgets, customizable tools that add interactivity and functionality, such as search bars, legends, and measurement tools. Whether you're building a basic map or a complex 3D visualization, GeoBlazor and ArcGIS give you the tools to bring your geospatial data to life.
Creating Your First GIS Map in Blazor
In addition to the free, open-source GeoBlazor Core, GeoBlazor Pro includes additional features and dedicated developer support. Let’s walk through the process of adding geospatial data and maps to your Asp.NET Core Blazor applications. For even faster setup, consider using the pre-configured GeoBlazor .NET templates.
Step 1: Adding your ArcGIS API Key
First, take the ArcGIS API key mentioned earlier and add it to the appsettings.json file in your Blazor project. (For tips on securing your key in production, check the GeoBlazor authentication guide.)
{
    "ArcGISApiKey": "yourKeyValue"
}
Step 2: Install GeoBlazor
Next, add a reference to the dymaptic.GeoBlazor.Core or dymaptic.GeoBlazor.Pro NuGet package. You can do this via your IDE's package manager or the command line.
dotnet add package dymaptic.GeoBlazor.Core
# or
dotnet add package dymaptic.GeoBlazor.Pro
NOTE: GeoBlazor Pro includes a reference to Core, so there's no need to install both.
Step 3: Configure HTML Resources
Add the required CSS and resources to your HTML. The location depends on your Blazor app type:
- Blazor Web Apps: Update
App.razor. - Blazor Server Apps: Update
_Layout.cshtml. - Blazor WebAssembly Apps: Update
index.html.
<!-- GeoBlazor Core -->
<link href="_content/dymaptic.GeoBlazor.Core"/>
<link href="_content/dymaptic.GeoBlazor.Core/assets/esri/themes/light/main.css" rel="stylesheet" />
<link href="YourProject.styles.css" rel="stylesheet" />

<!-- GeoBlazor Pro -->
<link href="_content/dymaptic.GeoBlazor.Core" />
<link href="_content/dymaptic.GeoBlazor.Pro" />
<link href="_content/dymaptic.GeoBlazor.Core/assets/esri/themes/light/main.css" rel="stylesheet" />
<link href="YourProject.styles.css" rel="stylesheet" />
(depending on your project template, you might already have the YourProject.styles.css reference)
Step 4: Import Usings for GeoBlazor Components
To gain access to GeoBlazor components, add the following using statements to _Imports.razor:
NOTE: In the upcoming GeoBlazor 4 release, some of these namespaces will be changing. The list will be updated at https://docs.geoblazor.com/pages/gettingStarted.html when we release version 4.
@using dymaptic.GeoBlazor.Core
@using dymaptic.GeoBlazor.Core.Components
@using dymaptic.GeoBlazor.Core.Components.Geometries
@using dymaptic.GeoBlazor.Core.Components.Layers
@using dymaptic.GeoBlazor.Core.Components.Popups
@using dymaptic.GeoBlazor.Core.Components.Renderers
@using dymaptic.GeoBlazor.Core.Components.Renderers.ColorRamps
@using dymaptic.GeoBlazor.Core.Components.Symbols
@using dymaptic.GeoBlazor.Core.Components.Views
@using dymaptic.GeoBlazor.Core.Components.Widgets
@using dymaptic.GeoBlazor.Core.Events
@using dymaptic.GeoBlazor.Core.Model
@using dymaptic.GeoBlazor.Core.Objects
You can also include these using directives directly in individual pages or components if preferred.
Step 5: Configure Startup Code
Add the GeoBlazor service to your app’s startup configuration in Program.cs:
// GeoBlazor Core
builder.Services.AddGeoBlazor(builder.Configuration);
// GeoBlazor Pro
builder.Services.AddGeoBlazorPro(builder.Configuration);
Step 6: Create Your First Map
Now, define your map within a Blazor page (e.g., Index.razor). Start by adding a MapView, which acts as a container for your map and controls interactivity.
<MapView Style="height: 400px; width: 100%">
</MapView>
A MapView alone won't display anything just yet. However, the map view allows you to define a Class or Style parameter to define the boundaries of your map. It will also be used to control many aspects of map interactivity.
Inside the MapView, let’s add a Map and a Basemap. A Basemap is the visual foundation of your map, often including road networks, topographical features, or imagery. There are about 60 ArcGIS and OpenStreetMap basemap styles available by selecting from an enum in GeoBlazor.
<MapView Style="height: 400px; width: 100%">
    <Map>
        <Basemap>
            <BasemapStyle Name="BasemapStyleName.ArcgisImagery" />
        </Basemap>
    </Map>
</MapView>
Step 7: Run Your Application
Run the application, and you should see your first GIS map with an ArcGIS Imagery basemap!
 GeoBlazor First Sample
Customizing Your GeoBlazor Map
Now that we’ve created a basic map, let’s take it further by zooming in, centering it on a specific location, and adding interactive features.
Adjusting MapView Settings
The default map is zoomed out to show the entire globe. To focus on a specific area, we can define the Latitude, Longitude, and Zoom parameters in the <MapView> component. Here’s how to center the map over Chicago, Illinois, with a medium zoom level:
<MapView Style="height: 400px; width: 100%"
         Latitude="41.8873"
         Longitude="-87.6195"
         Zoom="4">
    <Map>
        <Basemap>
            <BasemapStyle Name="BasemapStyleName.ArcgisImagery" />
        </Basemap>
    </Map>
</MapView>
GeoBlazor Sample with Latitude, Longitude, and Zoom defined
This centers the map on Chicago, but the zoom level of 4 still shows a broad view. Let’s change the Zoom parameter to 12 for a close-up view of the city.
 Close-up map of Chicago
With this update, the map provides a focused view of downtown Chicago, making it perfect for localized applications.
Adding Interactive Search
To enhance usability, we can add a SearchWidget to let users find specific locations directly on the map. The widget is straightforward to implement—simply place the <SearchWidget> component inside the <MapView> and specify its Position parameter.
Here’s an updated example with the search widget positioned at the top-right corner of the map:
<MapView Style="height: 400px; width: 100%"
         Latitude="41.8873"
         Longitude="-87.6195"
         Zoom="4">
    <Map>
        <Basemap>
            <BasemapStyle Name="BasemapStyleName.ArcgisImagery" />
        </Basemap>
    </Map>
    <SearchWidget Position="OverlayPosition.TopRight" />
</MapView>
Map with Search Widget
With this addition, users can type destinations directly into the search box. For example, typing "Field Museum" zooms the map to this Chicago landmark. Try it out below.
Interactive Search Widget
Importing Custom Data
Finding one museum is great, but what if you want to display all museums in Chicago? This requires a reliable dataset and a method to load and visualize the data on your map. Here's how you can get started.
Step 1: Find a Data Source
For geospatial datasets, platforms like ArcGIS Living Atlas offer curated options. However, many business applications rely on proprietary or custom datasets. To simulate such a scenario, we’ll use the Institute of Museum and Library Services (IMLS) dataset, which provides comprehensive information about museums across the U.S.
Download the dataset from IMLS.gov and open the first CSV file. Filter the dataset by ADCITY = CHICAGO to isolate museums located in Chicago. Save the filtered results to a local file that your web app can access.
Step 2: Prepare Your Application to Read CSV Files
To import and process the CSV data in your Blazor application, use the CsvHelper library. Add the library to your project by running the following command in your terminal:
dotnet add package CsvHelper
The CsvHelper library simplifies reading and parsing CSV files, making it easier to convert your dataset into a format suitable for display on your map.
Step 3: Load and Parse the Data
Create a record type to represent the data fields you want from the CSV file. This allows for efficient deserialization and ensures your map only processes the necessary information.
public record MuseumRecord{[Name("COMMONNAME")]public required string CommonName { get; init; }[Name("GSTREET")]public required string StreetAddress { get; init; }[Name("PHONE")]public required string PhoneNumber { get; init; }[Name("WEBURL")]public required string Website { get; init; }[Name("LATITUDE")]public required double Latitude { get; init; }[Name("LONGITUDE")]public required double Longitude { get; init; }[Name("DISCIPL")]public required string Discipline { get; init; }}
Define a private List<MuseumRecord> to store the parsed data:
private List<MuseumRecord> _records = [];Now, use CsvHelper in the
OnInitialized method of your Blazor page to read and populate the List:protected override void OnInitialized()
{
string filePath = Path.Combine(WebHostEnvironment.WebRootPath, "ChicagoMuseums.csv");
using StreamReader reader = new StreamReader(filePath);
using CsvReader csvReader = new CsvReader(reader, _csvConfiguration);
_records = csvReader.GetRecords<MuseumRecord>().ToList();
}
This loads the data into
Next, add a
_records, ready to be used for rendering graphics.Next, add a
GraphicsLayer to your Map to show the new data:<Map><GraphicsLayer @ref="_museumLayer" /></Map>private GraphicsLayer? _museumLayer;
Create a method to load the graphics after the map has rendered:
<MapView OnViewRendered="OnViewRendered">...private async Task OnViewRendered(){if (!_isLoaded){_isLoaded = true;await LoadMuseums();}}private async Task LoadMuseums(){await _museumLayer!.Clear();List<Graphic> graphics = [];PictureMarkerSymbol museumSymbol = new(MuseumIconUrl, 30, 30);FieldsPopupContent content = new([new FieldInfo("Discipline", "Discipline"),new FieldInfo( "StreetAddress", "Address"),new FieldInfo("PhoneNumber", "Phone Number"),new FieldInfo("Website", "Website")]);PopupTemplate popupTemplate = new("{CommonName}", contents: [content]);foreach (MuseumRecord record in _records){Point point = new Point(record.Longitude, record.Latitude);AttributesDictionary attributes = new(new Dictionary<string, object?>{{nameof(MuseumRecord.Discipline), record.Discipline},{nameof(MuseumRecord.CommonName), record.CommonName},{nameof(MuseumRecord.StreetAddress), record.StreetAddress},{nameof(MuseumRecord.PhoneNumber), record.PhoneNumber},{nameof(MuseumRecord.Website), record.Website}});Graphic graphic = new Graphic(point, museumSymbol, popupTemplate, attributes);graphics.Add(graphic);}await _museumLayer.Add(graphics);}private bool _isLoaded; private static readonly string MuseumIconUrl = "https://upload.wikimedia.org/wikipedia/commons/f/f8/Map_symbol_museum.svg";
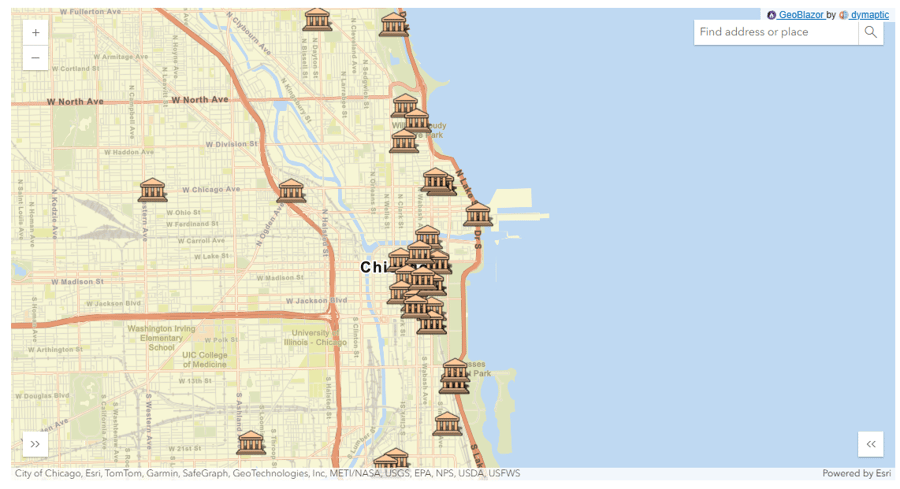
This method creates a
Graphic for each museum with a popup displaying its details, including the name, address, phone number, and website.Run your application to see the map with interactive markers for each museum in Chicago! Clicking a marker displays a popup with detailed information.

For more advanced features, such as basemap toggling, filtering, trip routing, and adding traffic layers, explore the complete code sample on GitHub.
Conclusion
Adding geospatial capabilities to your web applications opens a world of possibilities for visualizing, analyzing, and interacting with data in meaningful ways. Whether you're building tools for internal business insights or delivering rich, user-friendly maps for customers, GeoBlazor makes integrating GIS into your .NET applications straightforward and powerful. From plotting locations to creating interactive maps with layered data and widgets, the possibilities are limited only by your imagination. Ready to take your applications to the next level? Dive deeper into the features and documentation at GeoBlazor.com and start building smarter, location-aware solutions today!
Related articles


If you're maintaining an existing ASP.NET MVC application and want to add rich, interactive maps, you're not out of options. You don't need ...

In today’s enterprise asset-management world, users expect more than start-and-end mapping. They need interactive, near-real-time routing wi...