In today’s data-driven world, mapping business trends and insights can turn complex problems into actionable strategies. Using geographic in...
There are several good starting points if you want to get started with GeoBlazor: the documentation or our blog post on using templates are probably my two favorites. However, for this post, I will focus on a particular topic: using Geometry in GeoBlazor. In other words, putting points on a map, working with the Geometry Engine, and handling spatial references. Before we look at some code, let’s review a few core tenets of plotting points on the earth: geometry and spatial references. If you want to jump straight to the code, you can find the complete project over on GitHub.
Not your Math Teacher’s Geometry
In GIS, Geometry is the object we refer to that represents a location on Earth. It could be a point, like where you are right now, or a line that is a road or a river, or a polygon, an area like the outline of your home. These all have in common that they rely on either a single pair of numbers or a list of pairs of numbers. These pairs are often called “XY pairs.”
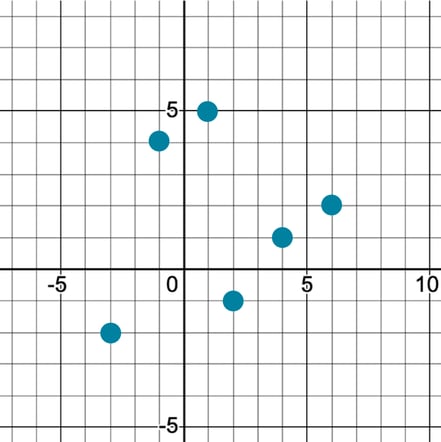
We often think of these XY pairs as being points on a Cartesian plane, like we would in math class:
This is a fine approximation for small areas, but we have a problem: Earth isn’t flat. To locate ourselves on Earth, we have latitude and longitude:
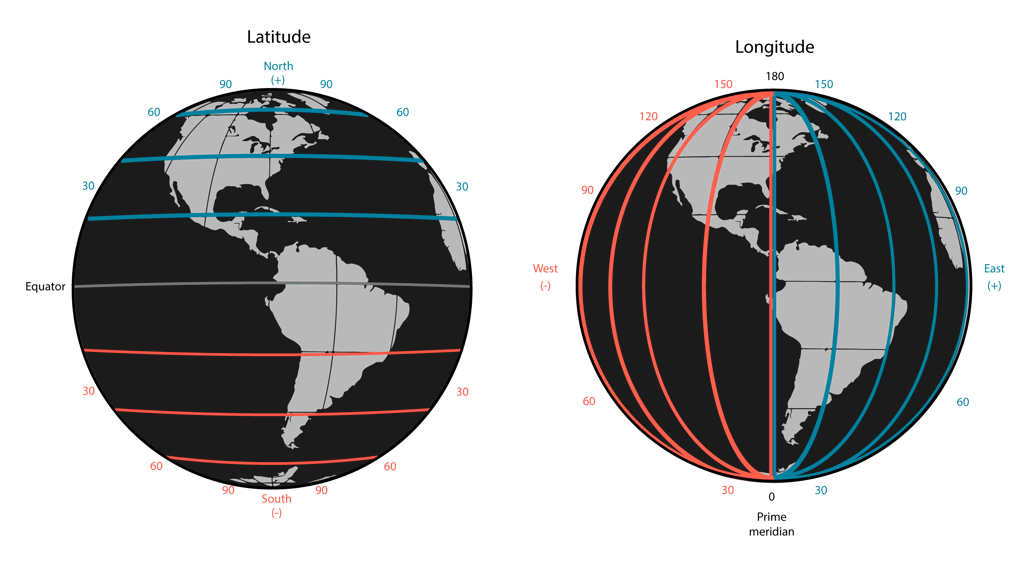
Latitude lines or “parallels” start at 0 at the equator and go positive up (north) and negative down (south); notice that this corresponds to the “y” in our Cartesian plane above. Longitude starts at the prime meridian and goes positive (east) and negative (west) until you get to the opposite side, where the international date line is! Again, these lines are more like the “x” values in our Cartesian plane.
Here is an easy thing to get confused about when we say “lat/long:” we mean “y/x”!
A latitude and longitude pair is not the only way to locate a point on Earth, and of course, there are complexities that I’m glossing over (Geodesy). But the important question to ask right now is this: How do I know, given two numbers, which one is the latitude and the longitude, or that those two numbers are even a lat/long pair? What if they are actually a phone number?
That would be a strange phone number, but the question is valid. The answer is: you can’t—not without some additional information, anyway. The computer has the same problem, so we must specify a spatial reference. This can't tell which number is which; we still need to keep track of that ourselves, but it instructs the computer how to plot those points and turn them into points on our screens.
If you're thinking there must be a trick to distinguish between latitude and longitude, you are partially right! Since latitude and longitude have different maximum values, it is possible to know that a number larger than 90 must be a longitude. When given large lists of lat/long pairs where I didn’t know which was which, I have used this as a trick. But it’s not reliable for a single pair of numbers that are both, say, less than 90!
Spatial References (a.k.a. Projections)
A spatial reference tells the computer what type of XY or lat/long you have specified. It allows the computer to “project” or “convert” that into a standard system (or between different systems) and, ultimately, to display on the screen.
We won’t discuss choosing a spatial reference in this post, but we want to specify it. If you have latitude and longitude points when using GeoBlazor, you should probably use the spatial reference WGS84.
Flat vs Round
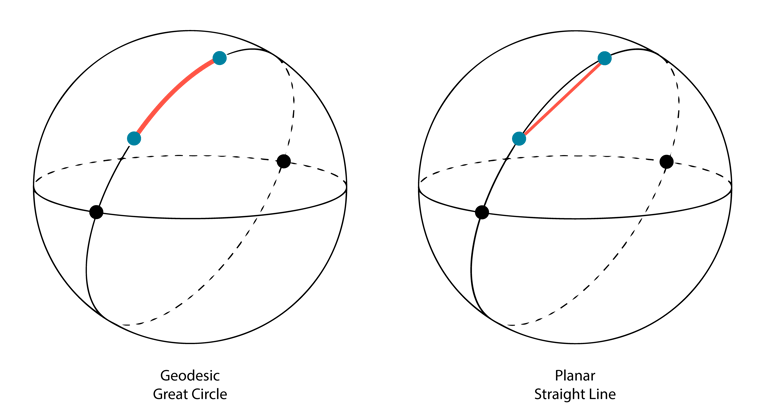
There are differences between a geodesic (spherical) and a planar (or Euclidian or Flat) coordinate system. A geodesic system, like WGS84, is round or sphere-like. A planar system is flat, like graph paper.
The key problem is that we want to show a round thing (Earth, or at least part of it) on a flat computer screen. (You could use a 3D scene to represent data, but sometimes it’s easier for our users to use a 2D map). The spatial reference tells the computer how to do that conversion.
If I want to draw a line on a flat map that follows the path you would take moving on Earth, also known as a “Great Circle path,” then I will need to use a geodesic system. If I want a straight line like I would draw on a simple graph, I want a planar system.
Both of these are useful, and which you use often depends on scale. If I want to show the path an airline will fly, I probably want a “Great Circle,” but a straight line is fine if I’m drawing lines to show where the water mains are in my city. Let’s look at some examples to see how we can correctly draw points and lines on the screen. For this, we’ll use the Geometry Engine, a handy library in the ArcGIS Maps SDK for JavaScript, which means it’s also available in GeoBlazor.
Putting a Point on the Screen
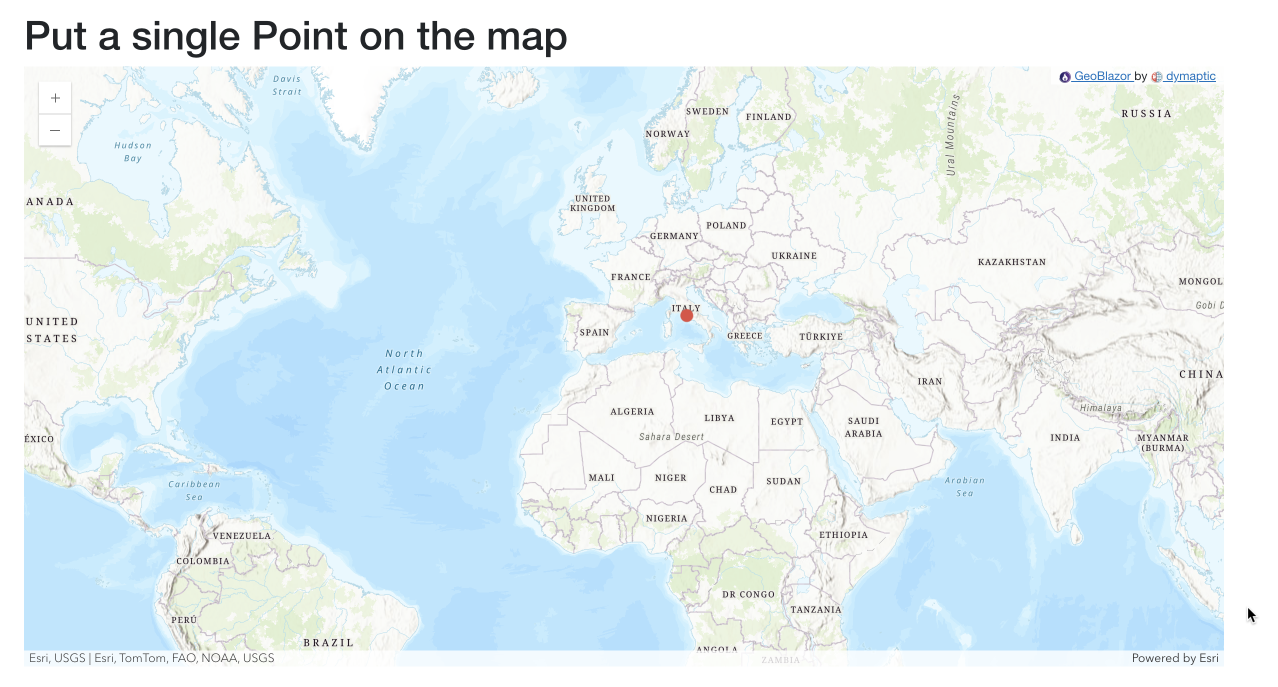
Let’s start by adding a simple point to our Map.
// Create a point on Rome, Italy (lat: 41.9102083, long: 12.3708505)
var point = new Point(x:12.3708505, y:41.910283, spatialReference:SpatialReference.Wgs84);
// Create a Red dot symbol
var symbol = new SimpleMarkerSymbol( new Outline(new MapColor("#E24E42"), 0), new MapColor("#E24E42"), 10, SimpleMarkerStyle.Circle);
// Create the graphic
var graphic = new Graphic(point, symbol); // add it to the map
await _mapView.AddGraphic(graphic);
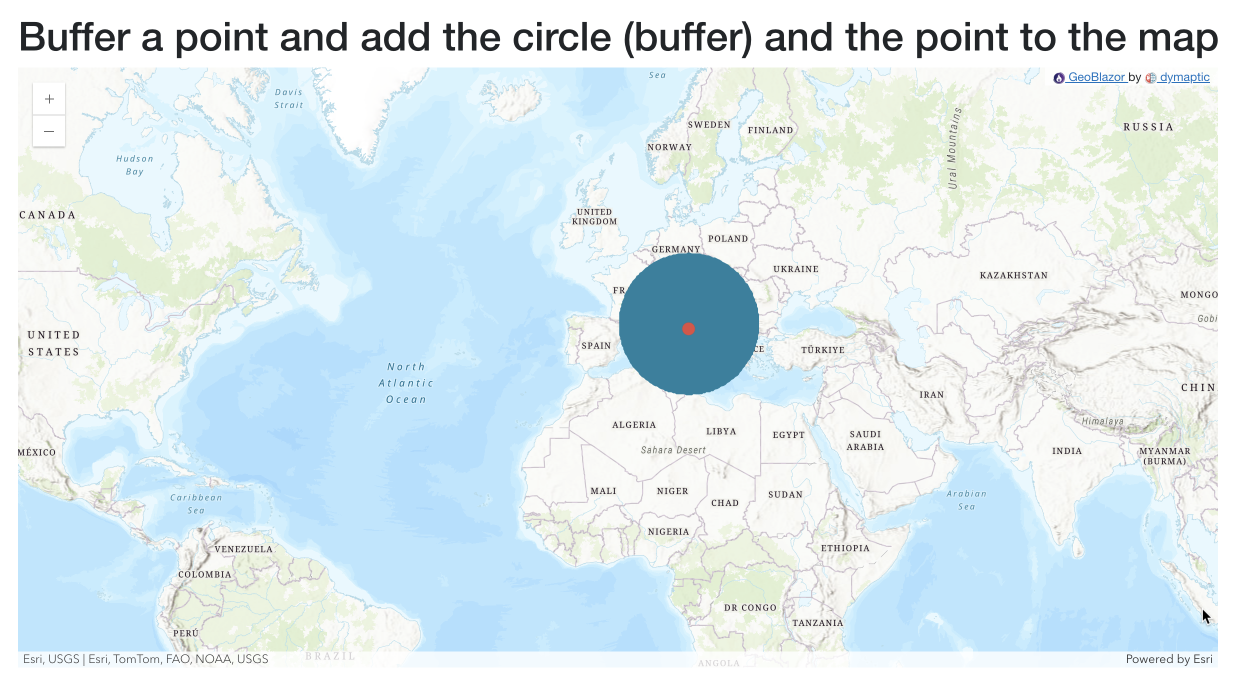
Buffer a point
Now that we have a point, let’s turn it into a circle. In GIS terms, we call this “buffering;” we are adding some distance around all sides of the point. (Pro Tip: You can buffer anything, such as a point, line, or polygon!)
// Create a point on Rome, Italy (lat: 41.9102083, long: 12.3708505)
var point = new Point(x:12.3708505, y:41.910283, spatialReference:SpatialReference.Wgs84);
// buffer the point by 1000km
// Note that b/c we use WGS84, we need to use the GeodesicBuffer method. The plain `Buffer` method should be used with planar coordinate systems
var buffer = await GeometryEngine.GeodesicBuffer(point, 1000, LinearUnit.Kilometers);
// Create a Red dot symbol
var pointSymbol = new SimpleMarkerSymbol( new Outline(new MapColor("#E24E42"),0), new MapColor("#E24E42"), 10, SimpleMarkerStyle.Circle);
// create a blue circle symbol
var circleSymbol = new SimpleFillSymbol( new Outline(new MapColor("#1D809F"), 2), new MapColor("#1D809F"));
// Create the graphic
var bufferGraphic = new Graphic(buffer, circleSymbol);
var pointGraphic = new Graphic(point, pointSymbol);
// add it to the map
await _mapView.AddGraphic(bufferGraphic);
await _mapView.AddGraphic(pointGraphic);
In this example, we use the GeodesicBuffer method because our point is in WGS84, a geodesic spatial reference. If we used a planar spatial reference, we would use the Buffer method instead.
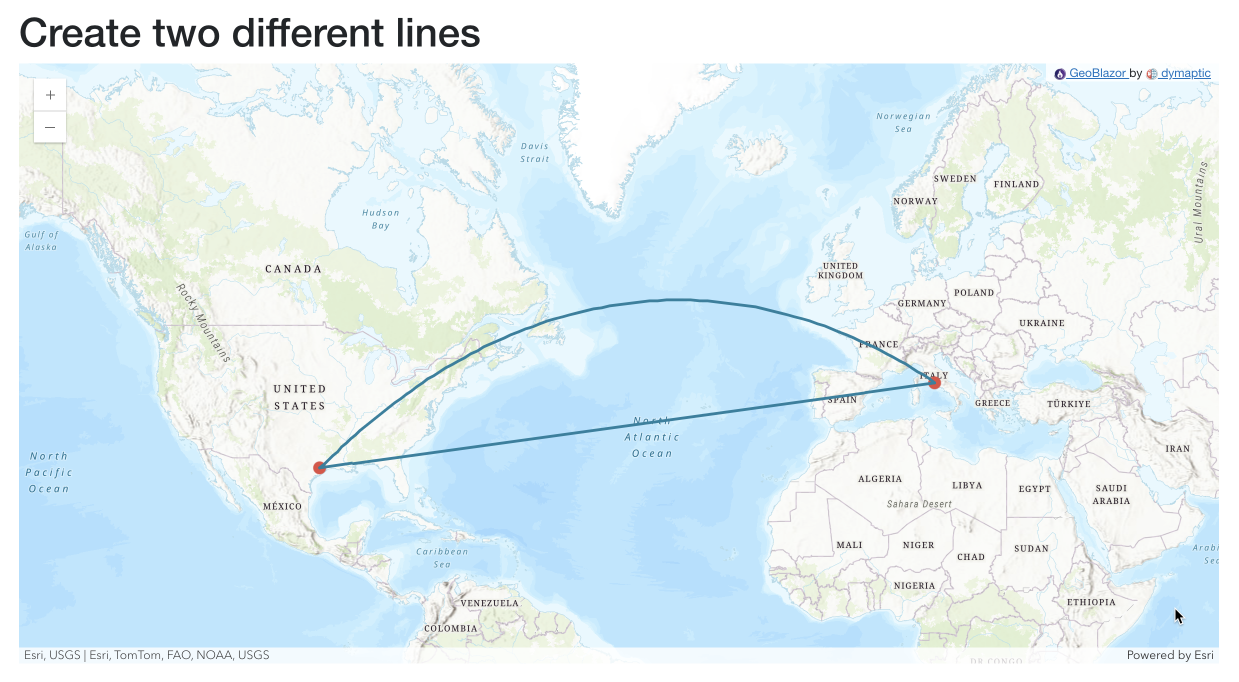
Draw a line between two points
We’ve been talking about “Great Circles” as a way to explain the difference between geodesic and planar coordinate systems. Let’s demonstrate this by creating a long line and look at how we can display it in two different ways.
First, we’ll make a line with two points:
// Create a point on Rome, Italy (lat: 41.9102083, long: 12.3708505)
var pointRome = new Point(x:12.3708505, y:41.910283, spatialReference:SpatialReference.Wgs84);
// create a point on Houston, TX (lat: 29.817363, long: -95.7316106)
var pointHou = new Point(x:-95.7316106, y: 29.817363, spatialReference:SpatialReference.Wgs84);
// Create a line between the two points
var line = new PolyLine(new MapPath[]
{
new MapPath(
new MapPoint(new double[] {(double)pointRome.X!, (double)pointRome.Y!}),
new MapPoint(new double[] {(double)pointHou.X!, (double)pointHou.Y!}))
}, SpatialReference.Wgs84);
This looks like a straight line. If we want a curved line instead, we must “densify” or create more points along that line to tell it where to be. We can do that by using the GeometryEngine again:
// Densify the line to make a nice arc
var arc = await GeometryEngine.GeodesicDensify(line, 100, LinearUnit.Kilometers);
When we create geometries like this that have many vertices, we need to increase the maximum message size in SignalR, which we can do in our Program.cs file, like this:
builder.Services.AddSignalR(options =>
{
options.MaximumReceiveMessageSize = 10 * 1024 * 1024; // 10MB
});
Distortion, oh my!
One side effect of going from round Earth to flat maps is distortion. For example, in this map we can see Antarctica stretch all across the bottom. However, the land area of Antarctica is actually 14,200,000 km2, roughly twice the size of Australia. I added a point at the equator with a buffer of the same size as Antarctica – which, you can see, looks very different in size than the continent that takes up the bottom of the map!
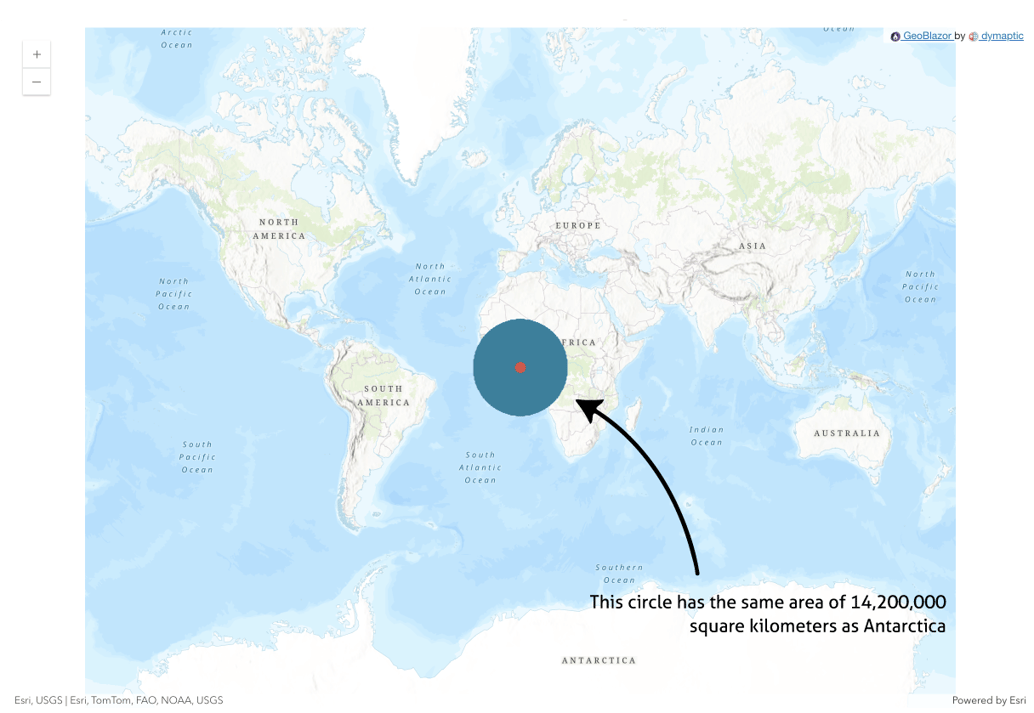
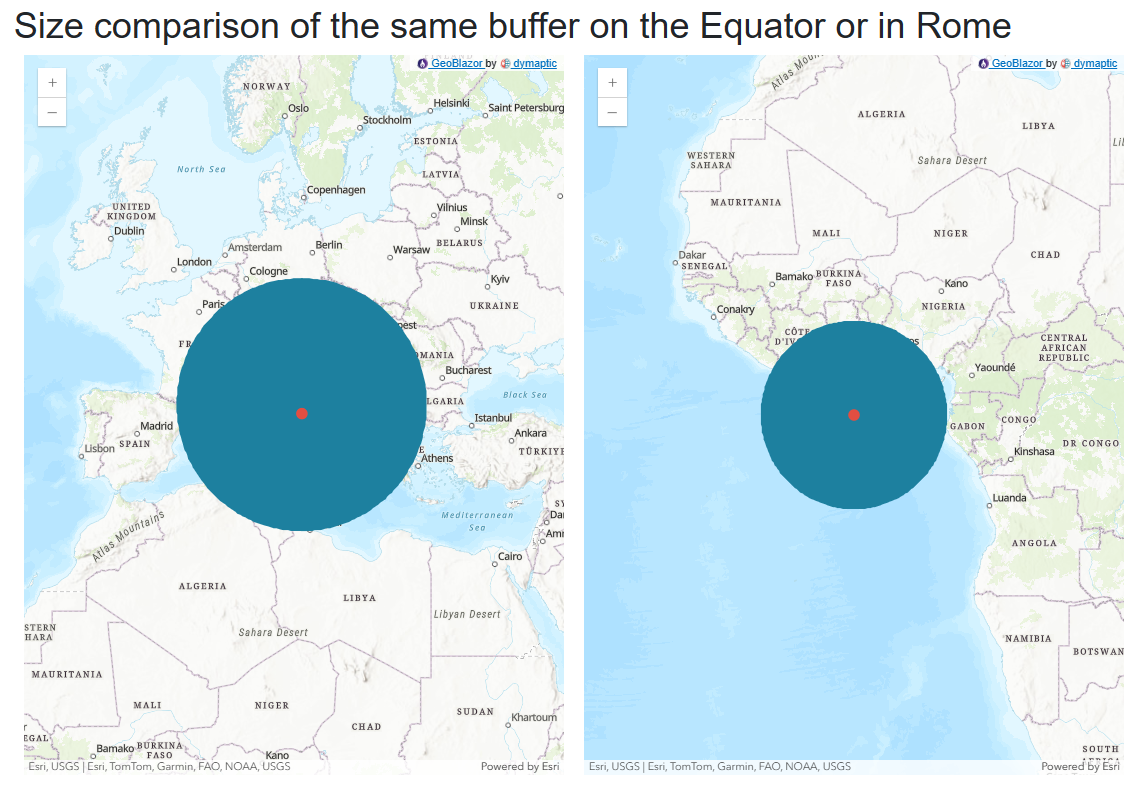
And here, we can compare two circles with the same buffer area - one at the equator, and one at our point in Rome. Because of distortion, they appear to be different sizes on the map.
Different spatial references cause different types of distortions. A great example of how the distortion works can be seen in this GeoBlazor sample:
You can try this yourself here: https://samples.geoblazor.com/projection
And that’s it! With GeoBlazor, along with this basic understanding of geometry, you’re set to start building apps, with maps! Reach out if there’s a solution we can help you with.
Stay tuned for an upcoming post on the use of layers in maps, and how we can organize data using layers.
Related articles

.webp?width=500&name=A-Transformation-in-Location%20(1).webp)
Imagine transforming your .NET web applications with cutting-edge mapping capabilities. GeoBlazor 4.0 turns this vision into a reality.

If you're maintaining an existing ASP.NET MVC application and want to add rich, interactive maps, you're not out of options. You don't need ...