ArcGIS Reporting: (Y)et (A)nother (R)eporting (T)ool

….it seems like making quick, shareable, easy, dynamic reports from ArcGIS Online data should be a solved problem. Yet, it isn’t. Until now.
Recently we’ve been talking more about our new ArcGIS reporting tool, infomaptic. I’d like to take a few minutes to explain what it is and why we built it. I’m sure that at least some of you are thinking things like:
- yart!? ¹, why would you build this?
- there are so many of these, another one?
- I thought you were making a programming language, what happened to that? ²
- are you a custom development company or a software company?
- While doing custom development work we were continuously asked to make tools that exported a PDF or HTML report from ArcGIS “just so”
- There’s always some little bit of processing or formatting or something to do when making reports
- Sometimes you need a way to quickly report on some data or attributes
- I got tired of writing the same code for multiple clients
What is infomaptic?

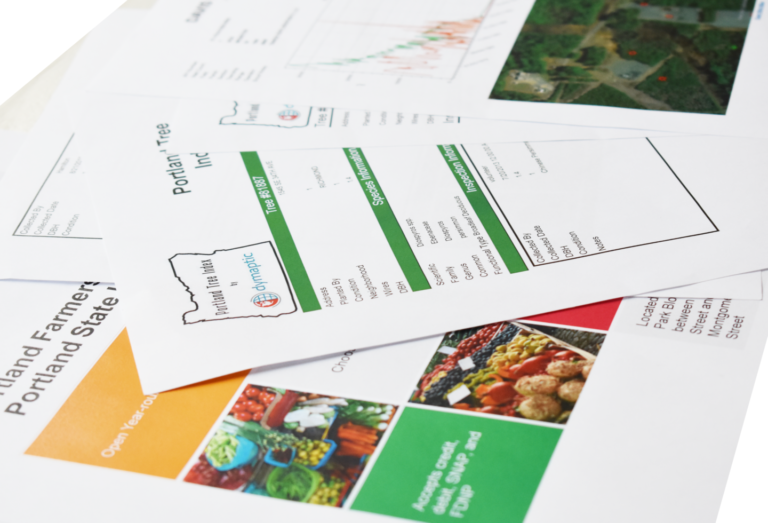
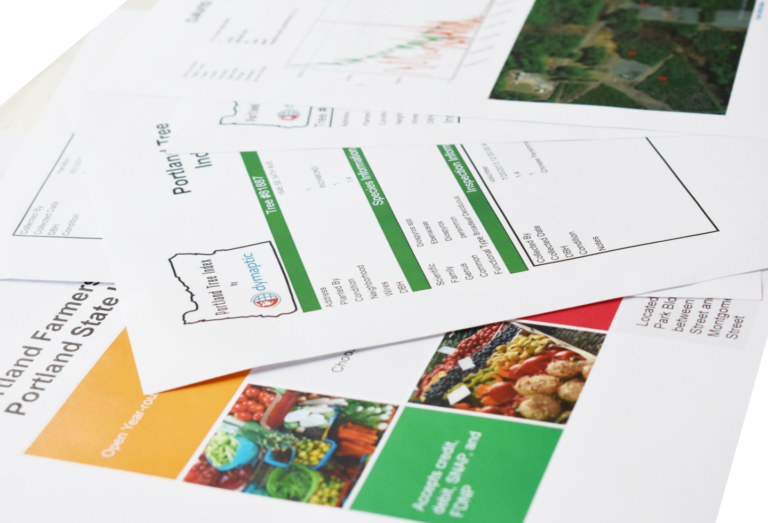
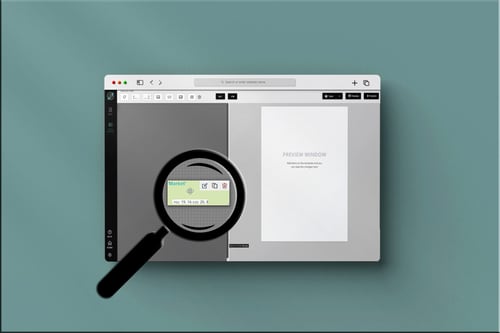
Infomaptic is a tool that allows you to design a template that can be applied to any record in an associated Esri Feature or Map Service from either ArcGIS Online or Enterprise. The template can then be used to generate an HTML or PDF document. It can handle things like related records, graphs, charts, and maps, but for now, we are focusing on simple reports that show attributes, static text, and images. We took it a step further by adding a scripting language behind it so that you can change the data or even alter the look of the report with simple expressions. With this language (that we call Atelerix) it should be easy to do things like display the year from a date field.
date.DatePart(data.my_date_field.value, 'YEAR')It may sound simple, but combining a simple template layout engine with a scripting language that’s custom made to transform data creates a very powerful reporting tool that is simple to use and can grow with your reporting needs.
The need for an ArcGIS reporting tool
Dymaptic has been around for four years now! It has been an exciting time with its ups and downs, but one ³ constant has been clients asking us to build a report for this or a PDF for that. There are plenty of tools out there (and we’ve now used several trying to find solutions for our clients), but none that were cost-effective or flexible enough to do what we needed. Also, there are very few that can connect directly to an ArcGIS Feature or Map Service in ArcGIS Online or Enterprise and load that data into a report.
So about a year ago, we started working on a backend engine that could convert a JSON configuration file to an HTML page using a very simple grid layout. We’ve used it both internally and on client projects and it has come a long way! It can now not only do simple data output, but graphs, charts, maps, and ArcGIS attachments from either SQL databases or ArcGIS Services. It proved to be so powerful that we felt we needed to add a UI to design the reports and let folks start using it on their own.
That little bit of tweaking
Data isn’t perfect and every time I build a report I realize that again. I want the date formatted differently or this value converted to camel-case instead of upper-case. Or even something more complex like buffering a point on a map.
I don’t want to keep adding more columns or more feature services that require a python script to be executed to generate them. That seems old-fashioned in today’s world of on-demand-everything! While we were working on the reporting tool backend I was also tinkering with the idea of building a very lightweight scripting language to generate data on the fly (that’s probably worth an entire blog post on its own). It was the combination of these things that got me thinking that the scripting language should be built right into infomaptic!
The rest is history, as they say. We now have a pretty great reporting tool (we are even using it internally to report on our own hours, projects, vacation, etc.) that’s powered by a very light scripting language that gives the report so much flexibility!
I’m really excited to start sharing this tool with you in the coming weeks and months as we officially launch infomaptic reports for ArcGIS Online!
- I’ll admit that YART (Yet Another Reporting Tool) is a catchy name, but I didn’t think of it until now, which is way after we decided to call it infomaptic.
- It’s still here! It’s called Atelerix and it powers a lot of the flexibility of infomaptic. More on it soon!
- Not strange in a bad way, but strange in that it seems like making quick sharable, easy, dynamic reports should be a solved problem already!


